Geological maps are among the most important tools for understanding the structure of the Earth’s surface and subsurface. They are more than just colored images of mountains, plains, and cliffs; they are a technical language used by geologists to illustrate the Earth’s history, rock types, structures, faults, folds, mineral resources, and the geological conditions of a particular region.
In short, a geological map shows the type, age, distribution, relationships, and arrangement of rock strata in a given area, as well as important tectonic features. This information is widely used in civil engineering, mineral exploration, groundwater assessment, dam and tunnel construction, road construction, environmental studies, and even site selection for industrial facilities.
Next, we will take a closer look at the main components of geological maps, the common symbols, the use of colors, and the meaning of these maps.
What is a geological map?
A geological map depicts the geological features of a particular area and is projected onto a base map. This base map typically contains geographical information such as rivers, roads, cities, elevations, and contour lines; geological data such as rock boundaries, faults, stratigraphic trends, and different sedimentary zones are then plotted on top of it.
Unlike topographic maps, which primarily show the shape and height of the Earth’s surface, geological maps answer the following questions:
- What types of rock or sedimentary rocks make up the Earth’s surface?
- To which geological era do these rocks belong?
- Where are the boundaries between the rock layers?
- Are there any folds or cracks in the fault zone?
- What are the tilt angles and dimensions of the various celestial bodies of the Earth?
- Which areas are most important in relation to mining, water management, or geotechnics?
Geological maps thus represent a comprehensive picture of the state of knowledge in the fields of petrology, stratigraphy, tectonics, geomorphology and cartography.
1. Types of rocks and sedimentary rocks
One of the most important elements of a geological map is the type of rocks and sediments found in a particular area . Rocks are generally classified into three main categories:
- Igneous rocks
- Sedimentary rocks
- metamorphic rocks
Each geological feature on a map is typically identified by a specific color, symbol, and pattern. For example, one part of the map might depict limestone, another sandstone, and a third granite.
Sedimentary rocks on geological maps
Many maps show sedimentary rocks such as limestone, marl, shale, sandstone, conglomerate, and alluvial deposits. These rocks are of great importance for civil engineering and water management projects due to their varying permeability, mechanical strength, and reactivity with water or chemicals.
For example:
- Limestone can contain cracks and karst cavities.
- Slate can expand or contract upon contact with water.
- Alluvial deposits are common in plains and along riverbanks and are of great importance for groundwater.
- In some areas, marl can lead to slope instability and geotechnical planning problems.
Igneous rocks on a geological map
Igneous rocks such as granite, basalt, diorite, and gabbro are known for their characteristic colors and patterns. The presence of these rocks can indicate past volcanic activity or magmatic intrusions.
Basalt, for example, is typically a dense, weather-resistant rock, while granite becomes a granular soil under heavy erosion. Understanding these properties is crucial for the design of foundations, tunnels, roads, and industrial buildings.
metamorphic rocks
Marble, slate, gneiss, and quartzite are rocks that formed from primary rocks under high pressure and temperature. Their presence on geological maps generally indicates a complex tectonic history of the area.
2. Geological age of the rocks
Another important piece of information on geological maps is the relative or absolute age of rocks and sediment deposits . Geologists use the terms “geological eras” and “geological ages” to describe the age of rock strata.
The geological periods that are commonly shown on geological maps include the following:
- Precambrian
- Cambrian
- Ordovician period
- Silurian
- Devon
- Carboniferous period
- Permian period
- Triassic
- Jurassic period
- Cretaceous period
- Paleogene
- New genes
- Quaternary
Colors and abbreviations are frequently used to denote geological ages. For example, the youngest Quaternary deposits, including alluvial fans and fluvial sediments, are represented by light colors. Older stratigraphic units are indicated by other colors.
However, it should be noted that colors may vary slightly due to different cartographic standards. Therefore, maps or legends serve as the primary reference for the interpretation of colors and symbols.
3. Geological structures and boundaries of geological units
On a geological map, different rock layers are separated by lines. These lines are called geological boundaries or geological contact lines and mark the end of one rock layer or geological formation and the beginning of another.
There are different types of borders, including:
- Call confirmation
- Public communication
- secret or undisclosed contact
- Faulty connection point
- Level break
Call confirmation
When a geologist in the desert identifies a clear boundary between two rock layers, they draw a solid line along that boundary. This method of boundary demarcation is more reliable because its location is determined during fieldwork.
Public communication
The boundary between two units can sometimes be difficult to discern due to soil conditions, vegetation, mud deposits, or artificial structures. In such cases, the boundary is marked by a dotted or dashed line.
Faulty connection point
When two rock layers meet as a result of a fault, their boundary is defined as a fault. This is of great importance for engineering calculations, mining projects, and geological risk assessment.
4. Faults on geological maps
Faults are among the most important geological structures. A fault is a large crack in the Earth’s crust, along which movements occur.
Faults can cause ground displacement, valley formation, the creation of springs, the accumulation of mineral deposits, and an increased risk of earthquakes. Therefore, fault identification is important for engineering studies and urban development.
The following types of errors can be displayed on the map:
- natural dysfunction
- reverse refusal
- Drift failure
- horizontal landslide
- Sliding failure at right angles
- Lateral shift to the left
- Potential or hidden errors
The symbols used to represent faults on maps vary depending on the type of movement. For example, thrust faults are represented by a zigzag symbol next to the fault line. Slide faults are sometimes symbolized by arrows indicating the relative direction of movement between two fault blocks.
The investigation of faults is of particular importance in projects such as dams, power plants, transmission lines, storage tanks, industrial plants, tunnels and railways, as the presence of active faults or extensive cracks can affect the stability of the structure, the integrity of the foundations and the seismic behavior of the area.
5. Folding and layering of rocks
Geological maps show not only the types of rock, but also their spatial arrangement. Rock strata can run horizontally, inclined, folded, collapsed, or almost vertically.
To represent this information, structural symbols such as stratigraphic range and slope are used.
Shift extension
The orientation of rock strata indicates their horizontal direction. Put simply: if you look at the surface of a rock strata, their orientation shows whether the strata run in a north-south, east-west, or other direction.
earring
The inclination describes the angle and direction of the dip of geological layers. For example, a map might show a geological layer with an inclination of 30 degrees to the northeast.
This information is essential for interpreting underground structures. Geotechnical engineers also pay close attention to slope and trajectory data in slope stability analyses, tunnel planning, trench construction, and road construction.
fold
Folds are common in layered rocks, especially sedimentary rocks. They are generally divided into two categories:
- Convex folding: The layers bend upwards.
- Nodes: These layers curve downwards.
The axes of folds are clearly marked by lines on geological maps. Understanding anticlines and slopes is important for the exploration of oil, natural gas, groundwater, and minerals, as some folded structures can contain underground fluid reservoirs.
6. Rock overhangs
A rock outcrop is a section of rock or rock strata that is exposed at the Earth’s surface. In many areas, the underlying bedrock is covered by soil, younger sediments, vegetation, or buildings. In places like mountains, valleys, rivers, and natural cliffs, however, the rock is exposed as an outcrop.
Geological maps are primarily created through the study and analysis of rock outcrops. Geologists determine geological boundaries by observing color, texture, mineral composition, layer thickness, fossils, and the relationships between different stratigraphic units.
The higher the density of rock outcrops in an area, the more accurate the geological map. Conversely, areas with thick alluvial deposits, dense forests, shifting dunes, or densely populated urban areas may provide only relatively limited information about the geological properties of the surface.
7. Surface and alluvial deposits
The representation of recent surface deposits is one of the most important aspects of geological mapping. These deposits are particularly common in plains, on riverbanks, in deserts, and on mountain slopes.
The most important types of surface deposits include the following:
- River sediment deposits
- Alluvial deposits
- Wind deposits
- quicksand
- lake sediments
- swamp sediments
- Domain name registration
- rivers
These deposits often possess significant engineering and hydrogeological value. For example, coarse-grained silt deposits with high permeability are well suited for groundwater storage, while fine-grained clay deposits can exhibit very low permeability.
In arid and semi-arid regions, the identification of river courses, alluvial fans and younger deposits is crucial for flood studies, borehole site selection, surface water collection network planning and industrial plant construction.
8. Mineral resources and mineralization indicators
Some geological maps, especially those used for mineral exploration and mining, contain information about the location of deposits, traces of mineralization, veins and shafts.
These cards can display the following:
- Mines that are still in operation or have been closed down.
- Reconnaissance zone
- Quartz vein
- Fault zone
- mineral deposits
- Non-metallic reserves
- Building materials
- Money
- decorative stone
- Salt, chalk, artificial soil or other minerals
The presence of faults, fractures, and intrusive bodies is often associated with mineralization. For example, hydrothermal fluids can flow along faults, enriching certain elements and forming mineral deposits.
Geological maps alone are of course insufficient to confirm the presence of mineral deposits. Exploration also includes sampling, geochemical analyses, geophysical surveys, drilling, and feasibility studies.
9. Topographical information and geographical features
Although the primary purpose of geological maps is to present geological information, these maps are often based on topographic maps. Therefore, they may also contain the following elements:
- Contour lines
- Peaks and heights
- Rivers and waterways
- Away
- Cities and municipalities
- Administrative boundaries
- Railways
- Lakes and wetlands
- Springs and wells
This information allows users to more accurately locate geological phenomena in the real world. For example, they can identify fault intersections or elevations where limestone formations occur.
10. Scale of the geological map
The map scale is a fundamental piece of information on every geological map. It indicates which unit of length is represented on the map in reality.
For example, on the following scales:
: 100,000 1 :
In nature, every centimeter on the map corresponds to one kilometer.
Geological maps are created at different scales:
- Small-scale; suitable for regional and large-scale studies.
- Medium-sized; suitable for general geological investigations.
- Wide range of applications; suitable for engineering, mining and detailed research projects.
The higher the scale, the more detailed the map. For example, a map at a scale of 1:25,000 provides more detailed information than a map at a scale of 1:250,000.
Construction projects such as dams, factories, tunnels, waterways or industrial plants usually require more detailed geological maps and additional field studies.
A simple guide to septic tanks
11. Card Legend
To interpret a geological map correctly, it is important to first read the map legend . The legend explains all the colors, symbols, abbreviations, and signs used.
Map guides typically contain the following materials:
- Name of the geological unit
- Geological age of each layer
- Main rock types
- Each character has its own specific color.
- Error codes
- Fold symbol
- Regression and expansion indicators
- Location of mineral deposits or mineral markers
- Wells, springs or sampling points
- Information on scale and coordinate system.
Without a map legend, the colors and symbols on the map cannot be correctly interpreted . Therefore, the first step in analyzing any geological map is a thorough study of its legend.
12. Geological Section
Many geological maps contain geological cross-sections. A geological cross-section is an area drawn along a specific line on the map that shows layers, faults, and stratigraphic structures beneath the Earth’s surface.
Geological profiles can illustrate the following points:
- Approximate thickness of each layer
- Direction of inclination of the layered structure
- Folding form
- Extent of deep faults
- The relationship between underground rock layers
- There may be buried structures there.
These cross-sections are frequently used in studies on tunnels, dams, mining, geotechnics, groundwater and raw material exploration.
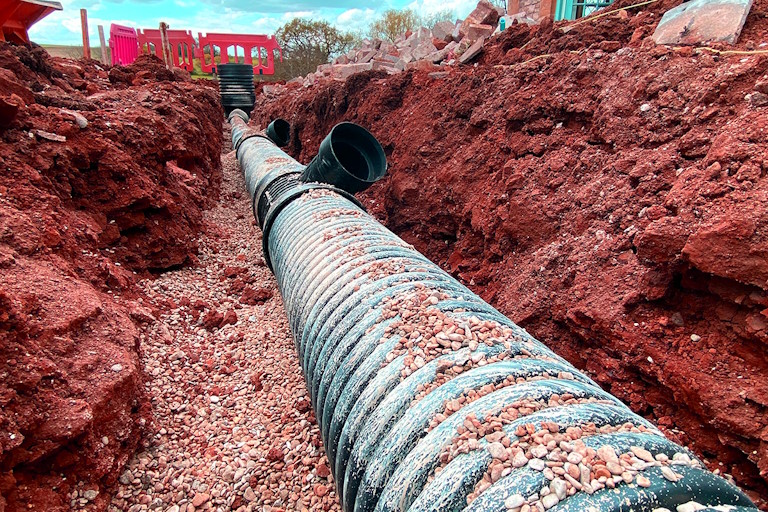
Application of geological maps in engineering projects
Geological mapping is not only used by geologists; it is also used in construction, mining, water management and environmental protection, the oil and gas industry, and many other fields.
The most important areas of application include the following:
Choose a suitable location for the building.
Before construction begins on large buildings, dams, factories, reservoirs, roads or pipelines, it is essential to investigate the condition of the subsoil, geological faults, soft soils and areas prone to landslides.
Groundwater studies
Geological maps can be used to identify permeable alluvial deposits, karst layers, clay layers and potential groundwater flow paths.
Mineral exploration
Rock type, faults, intrusions, alterations and veins can all influence the definition of areas that are prone to mineralization.
Geological risk assessment
Geological data can be used to more accurately assess risks such as landslides , subsidence, earthquakes, rockfalls, floods and slope instability.
Delivery of building materials
Geological maps can help identify deposits of sand, gravel , crushed stone , limestone, gypsum, clay and rocks suitable as building materials.
How do you read a geological map?
To read a geological map, follow these steps:
- To determine the geographical scope and content of a map, consult its title.
- Please refer to the map scale to understand the actual size of the items.
- To understand the meaning of the colors and symbols, please consult the map.
- Identify the main units of the geological strata and determine their age and type.
- The distribution of the configuration is determined along the boundaries of each block.
- To understand the tectonic structure of the area, one should pay attention to faults and folds.
- Analyze slope and extent signals to determine soil properties .
- Analyze the geological cross-section to better understand the area’s infrastructure.
- The cartographic data were supplemented by field studies, satellite images and geotechnical investigations.
In conclusion
Regarding the question “What does a geological map show?”, it should be noted that these maps provide comprehensive information about rock types, stratigraphic age, boundaries of geological units, faults, folds, stratigraphic extensions and slopes, surface deposits, rock outcrops, mineral resources and geographical features.
Geological maps are indispensable tools for understanding a region’s topography and play a crucial role in development planning, resource exploration, groundwater management, disaster impact assessment, and industrial project planning. Examining the symbols, colors, naming systems, and geological features on these maps provides valuable information about the Earth’s past and present.
Frequently Asked Questions
Do the colors on geological maps always have the same meaning?
No. While there are some general standards for color-coding geological ages, you should always use the same map, as different maps may use different colors and units of measurement.
What is the difference between a geological map and a topographic map?
Topographic maps show the height, slope, and roughness of the Earth’s surface, while geological maps show the type, age, and structure of rocks and sediments.
Can geological maps be used to locate groundwater?
This map can be used to identify permeable layers, silt deposits, fractured limestone and structures that affect water flow ; however, further hydrogeological, geophysical and drilling investigations are needed to accurately determine the location and depth of the groundwater.
Why are errors on geographical maps important?
Geological faults can affect the stability of buildings, earthquake hazards, groundwater flow, mineral concentrations, and stratigraphic features; therefore, faults are of great importance in construction and exploration.